- UK /
- Durham
Discover The Latest Property Statistics and Sold House Prices In Durham, Durham (County Of).
Gain a competitive edge in the Durham, Durham (County Of) housing market using our extensive data on house prices with local insights and trends.
DURHAM
Property market data for Durham in Durham (County Of). Compare data on the district postcode areas of Durham including sold house price growth, long let gross rental yield, buyer demand, average asking price, average price per square foot and average rental prices. Explore Durham with a range of tools to help you understand the local market.
In the centre of Durham, DH1 long-let gross yield is 4.6%, the average rental price is £226 the average asking price is £254,128 and the average price per square foot is £223. There are currently N/A completed property sales per month, with a turnover of 16.0%. Toggle between postcode districts to see how different areas compare.
THE PROPERTY MARKET IN DURHAM
Understanding the Housing Market in Durham: Key Facts and Figures
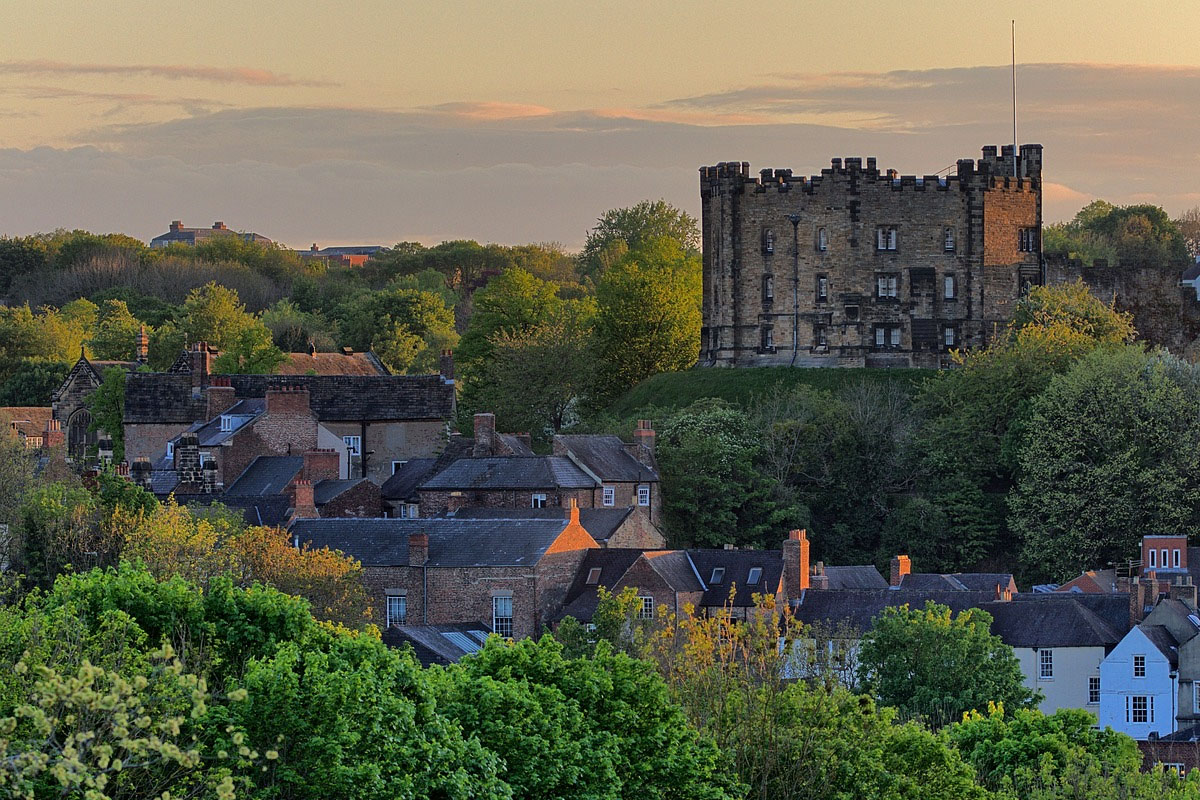
Sitting on the River Wear and with a population of approximately 50,000 people, Durham is a cathedral city and the administrative centre of the County Durham District in the northeast of England, just under twenty miles south of Newcastle-upon-Tyne. Even by English standards, it is ancient, with archaeological evidence that a settlement may have existed there, as far back as 2000 BCE. And yet, Durham itself has a foundation story that pins its formation to a specific year. Legend has it, that in 995 AD, monks escaping from a Viking raid of Lindisfarne, carried the body of Saint Cuthbert, an Anglo-Saxon saint, to settle his remains on the high peninsula on which the city now sits. When they arrived in 'Dun Holme' (Dun being the old English word for hill), they laid Saint Cuthbert's remains down and built a structure around them, which would become Durham Cathedral. Durham is famous for its history and architecture, so much so that the city centre is designated a World Heritage Site. As well as the 11th century Norman castle and the cathedral, there are 630 listed buildings in Durham, with 569 located within the city centre conservation area. No surprise then, that Durham is a major tourist destination, having attracted 15.77 million visitors, from home and abroad, in 2021. It is the university, however, for which Durham is perhaps best known. It is the third-oldest university in England after Oxford and Cambridge and like Oxford and Cambridge, is composed of a group of separate colleges (i.e. a collegiate structure). Durham University is recognised around the world for first-class scholarship and research and attracts around 20,000 students per year, who contribute a great deal to the economy and cultural life of Durham City. While the economy of the city is shaped in a big way by the university and large student population, other large employers can be found in public sector areas such as health, education and social services. Retail and wholesale are important industries and of course, many people work in tourism. But it is a small, historic, tourist city, whose length and breadth can be walked, easily and with that in mind, it should be unsurprising that there is very little office space and very few businesses that are not orientated around a high street presence. Further out from the city and into County Durham, however, the picture changes. In 2022 there were approximately 14,725 enterprises in County Durham, the area had a GVA of 9 billion and big, international businesses located throughout the county included Hitachi Rail Europe, Husqvarna, GlaxoSmithKline, Caterpillar, Ineos and Gestamp. Called a perfect little city, by author Bill Bryson and voted the 'Best City in the UK' by readers of Condé Nast’s Traveller magazine, Durham is not without considerable charm. The city is small and compact, with a variety of residential properties available, from old, period properties, to new-build apartments and houses. Prices can be very varied with, unsurprisingly, property located near the castle and cathedral being the most expensive and with areas like South Bailey and North Bailey also being quite pricey. However, there are more affordable areas in suburbs, closer to the A1(M), such as Gilesgate, Gilesgate Moor and Dragonville. Being a major student centre, there is significant demand for student accommodation, including student HMOs, and as a tourist destination, there is a significant market for serviced accommodation and holiday lets.